The Dashboard gives vendors a quick overview of their store performance inside the mobile app. From sales insights to order trends, everything is designed to help vendors monitor their business directly from mobile.
The dashboard uses a clean dark interface with visual charts, performance cards, and date-based analytics to make business tracking easier.
Dashboard Overview
When vendors open the app, they can instantly see:
- Total balance
- Sales performance
- Order trends
- Net sales
- Average order value
- Performance comparisons
- Date-based analytics
The dashboard is built for quick monitoring without needing complex reports.
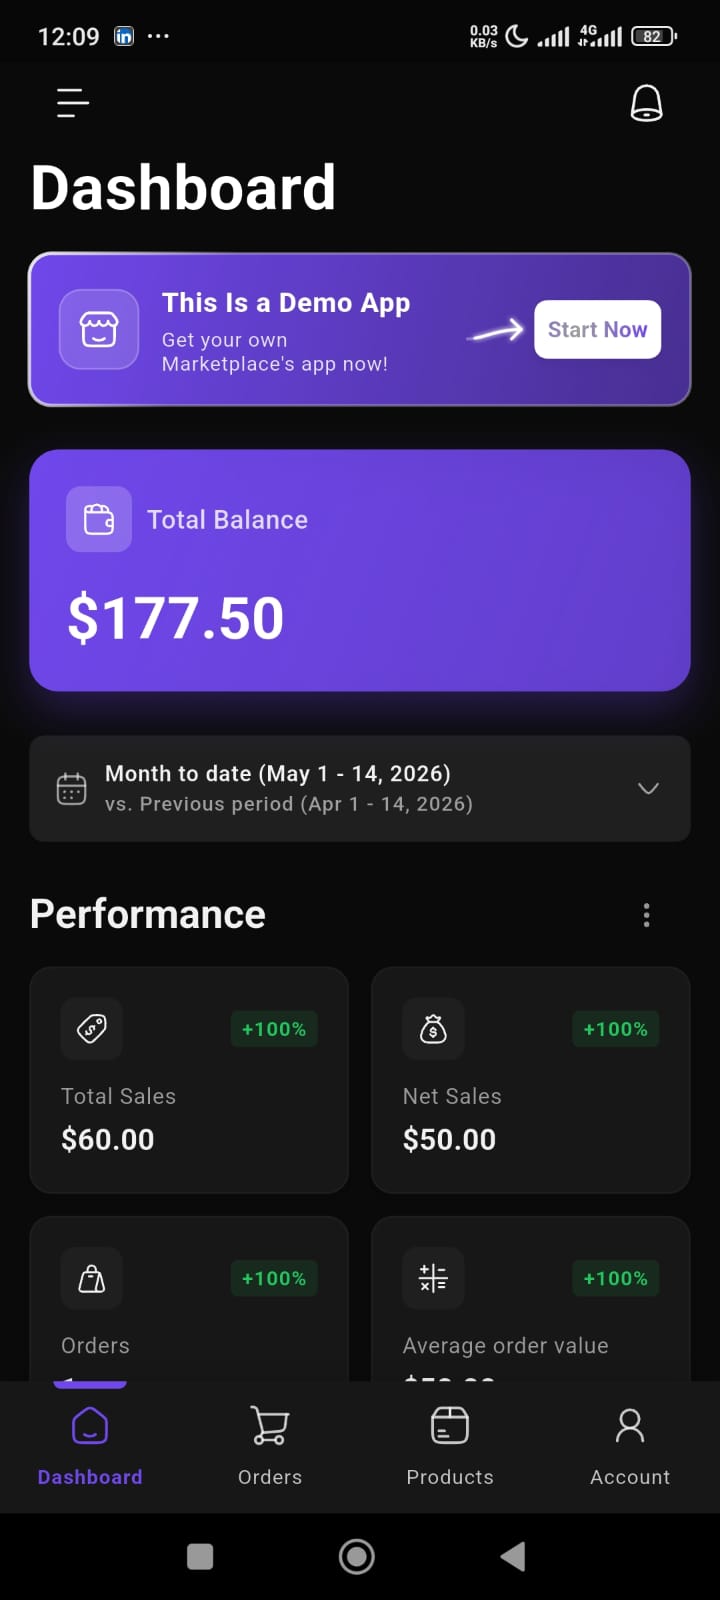
Total Balance Card
At the top of the dashboard, vendors can view their current balance.
This section highlights:
- current earnings
- available balance
- overall financial snapshot
The balance card is designed with a prominent visual layout so vendors can immediately track their store performance.
Date Range Filter
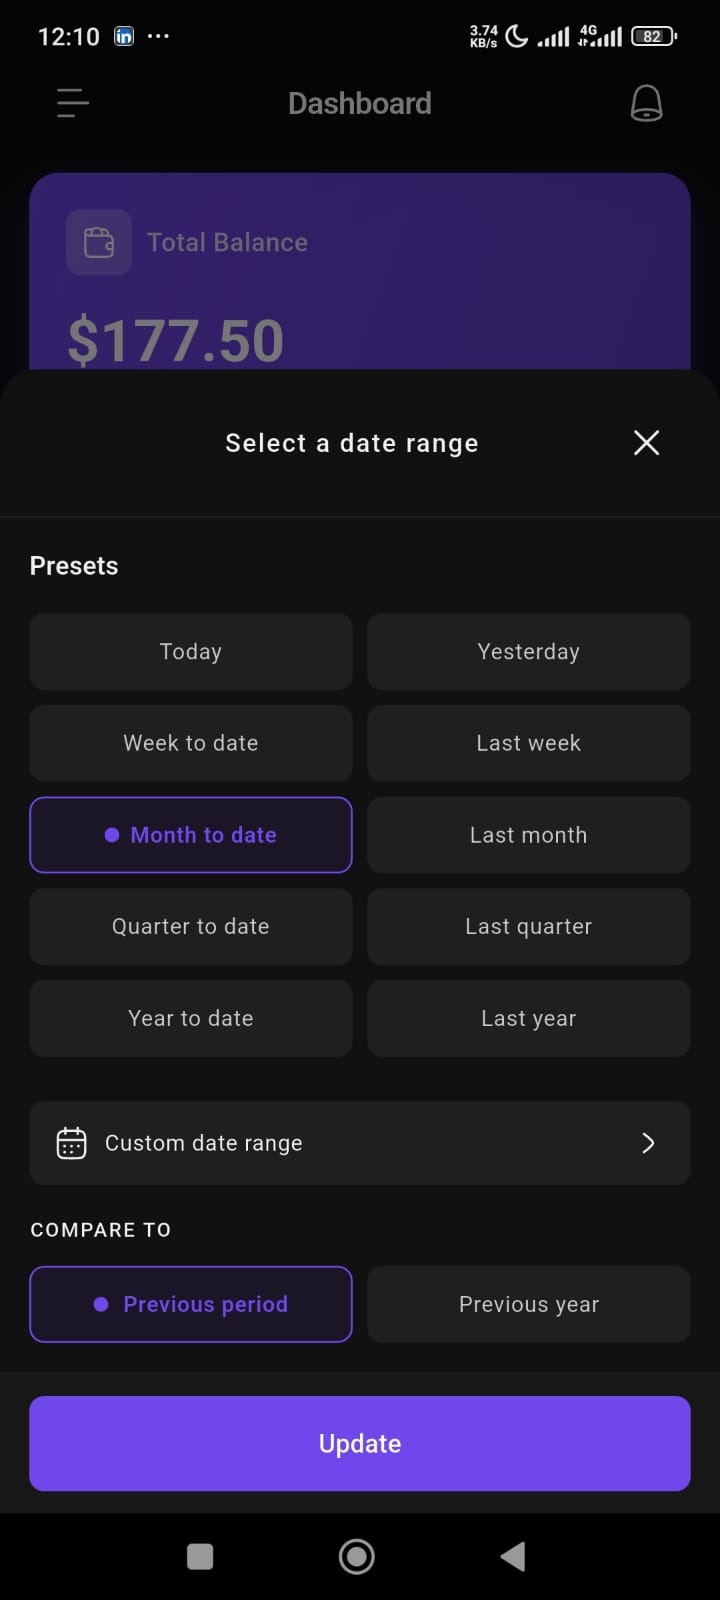
Vendors can customize analytics using different date presets.
Available options include:
- Today
- Yesterday
- Week to date
- Last week
- Month to date
- Last month
- Quarter to date
- Last quarter
- Year to date
- Last year
- Custom date range
This helps vendors analyze store performance across different time periods.
Compare Performance
The dashboard also supports performance comparison.
Vendors can compare current performance against:
- Previous period
- Previous year
This makes it easier to understand:
- growth trends
- sales fluctuations
- performance improvements
Performance Analytics
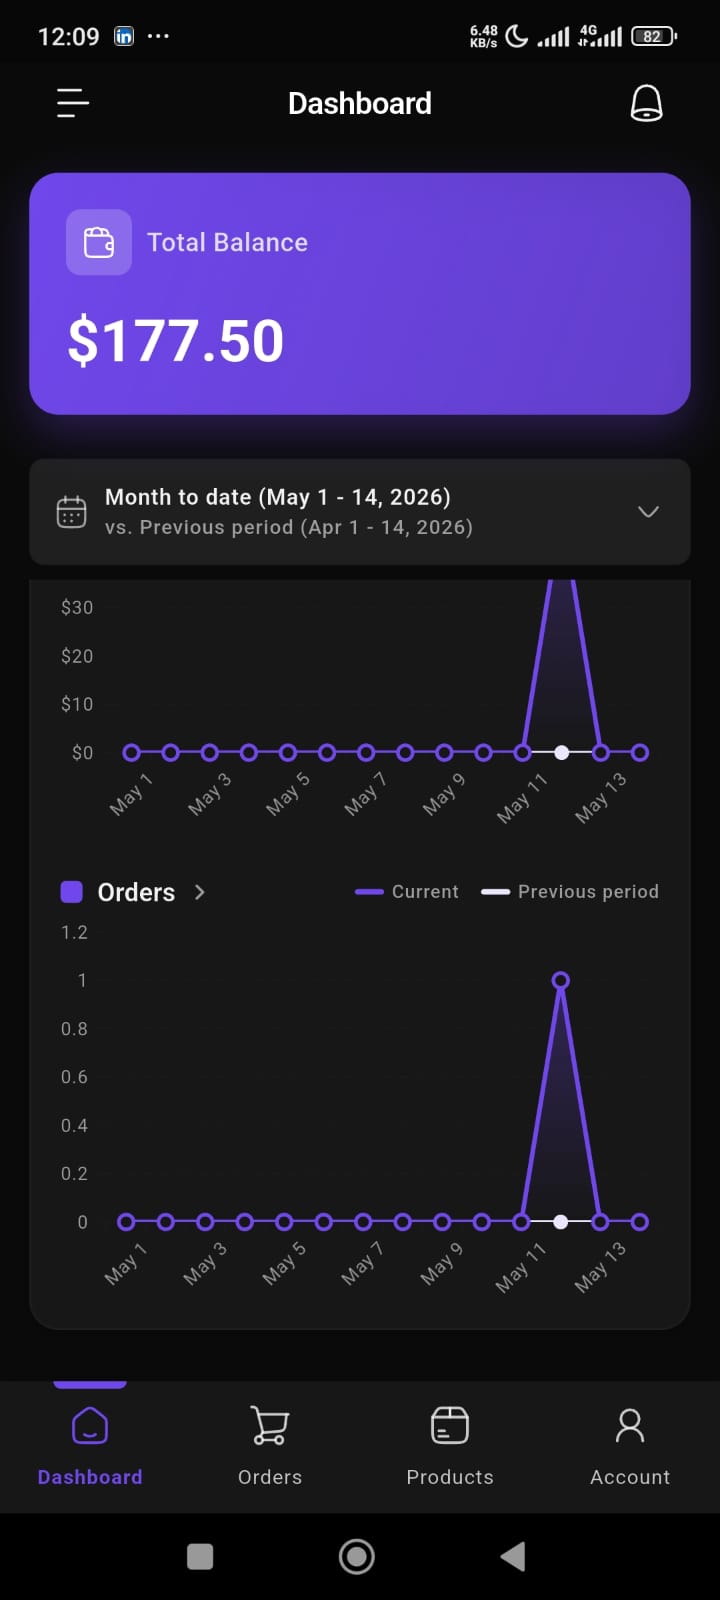
The dashboard includes visual charts for business insights.
Available chart metrics include:
- Total Sales
- Net Sales
- Orders
Charts help vendors quickly identify:
- sales spikes
- low-performing periods
- order trends
- business growth patterns
The comparison line visually separates:
- current performance
- previous performance
Performance Cards
The dashboard displays summary cards for important store metrics.
These include:
- Total Sales
- Net Sales
- Orders
- Average Order Value
Each card shows:
- metric value
- percentage growth
- overall performance snapshot
This helps vendors understand store health at a glance.
Chart Views
Vendors can switch chart visualization modes.
Available views:
- Day
- Week
This allows more flexible performance analysis based on business needs.
Marketplace App Promotion Banner
The dashboard also includes a promotional banner section.
This area can be used to:
- promote marketplace features
- display announcements
- advertise marketplace mobile apps
- highlight campaigns or onboarding messages
Mobile-First Experience
The entire dashboard is optimized for mobile usability.
The interface focuses on:
- easy navigation
- large visual cards
- quick insights
- clean chart presentation
- minimal complexity
This helps vendors manage their store performance anytime, directly from their phone.
Bottom Navigation
The app includes a bottom navigation bar for quick access.
Available sections:
- Dashboard
- Orders
- Products
- Account
This allows vendors to switch between core business operations quickly.