Dokan vendor dashboard includes a user-friendly report feature where vendors can immediately get an overview of their total expenditure. Also, it will help them to prepare product sales reports in an organized way.
So let’s see what the Dokan vendor report feature includes one by one:-
The report section includes six major parts:-
Products
Revenue
Orders
Variations
Categories
Stock
Statement
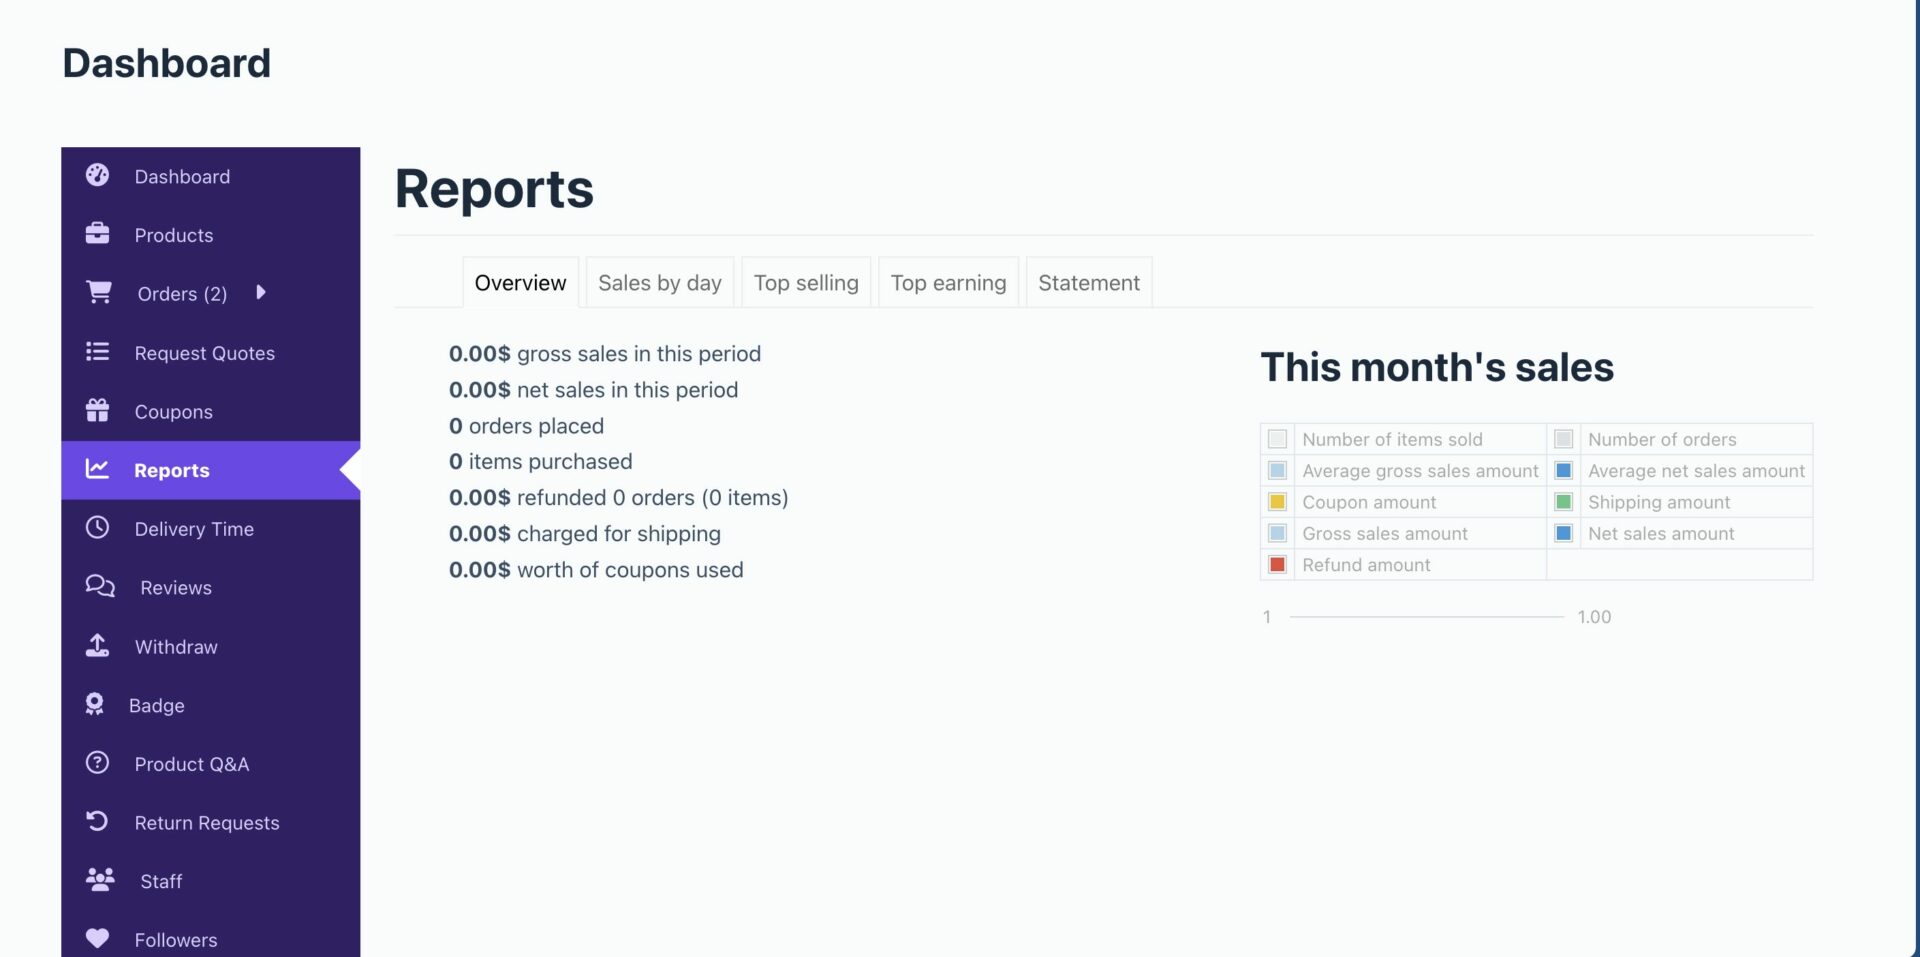
Overview
Sales Overview shows on the report page. On the top of the report, there are some options by which seller could view his sales report total overview, by day overview, top sale product reports and top-earning product reports.
Top Selling Products
In the products section, vendor can view their top-selling products, items sold, net sales, and number of orders. They can search for their products as well.
Vendor can filter the products with Single Product and Comparison.
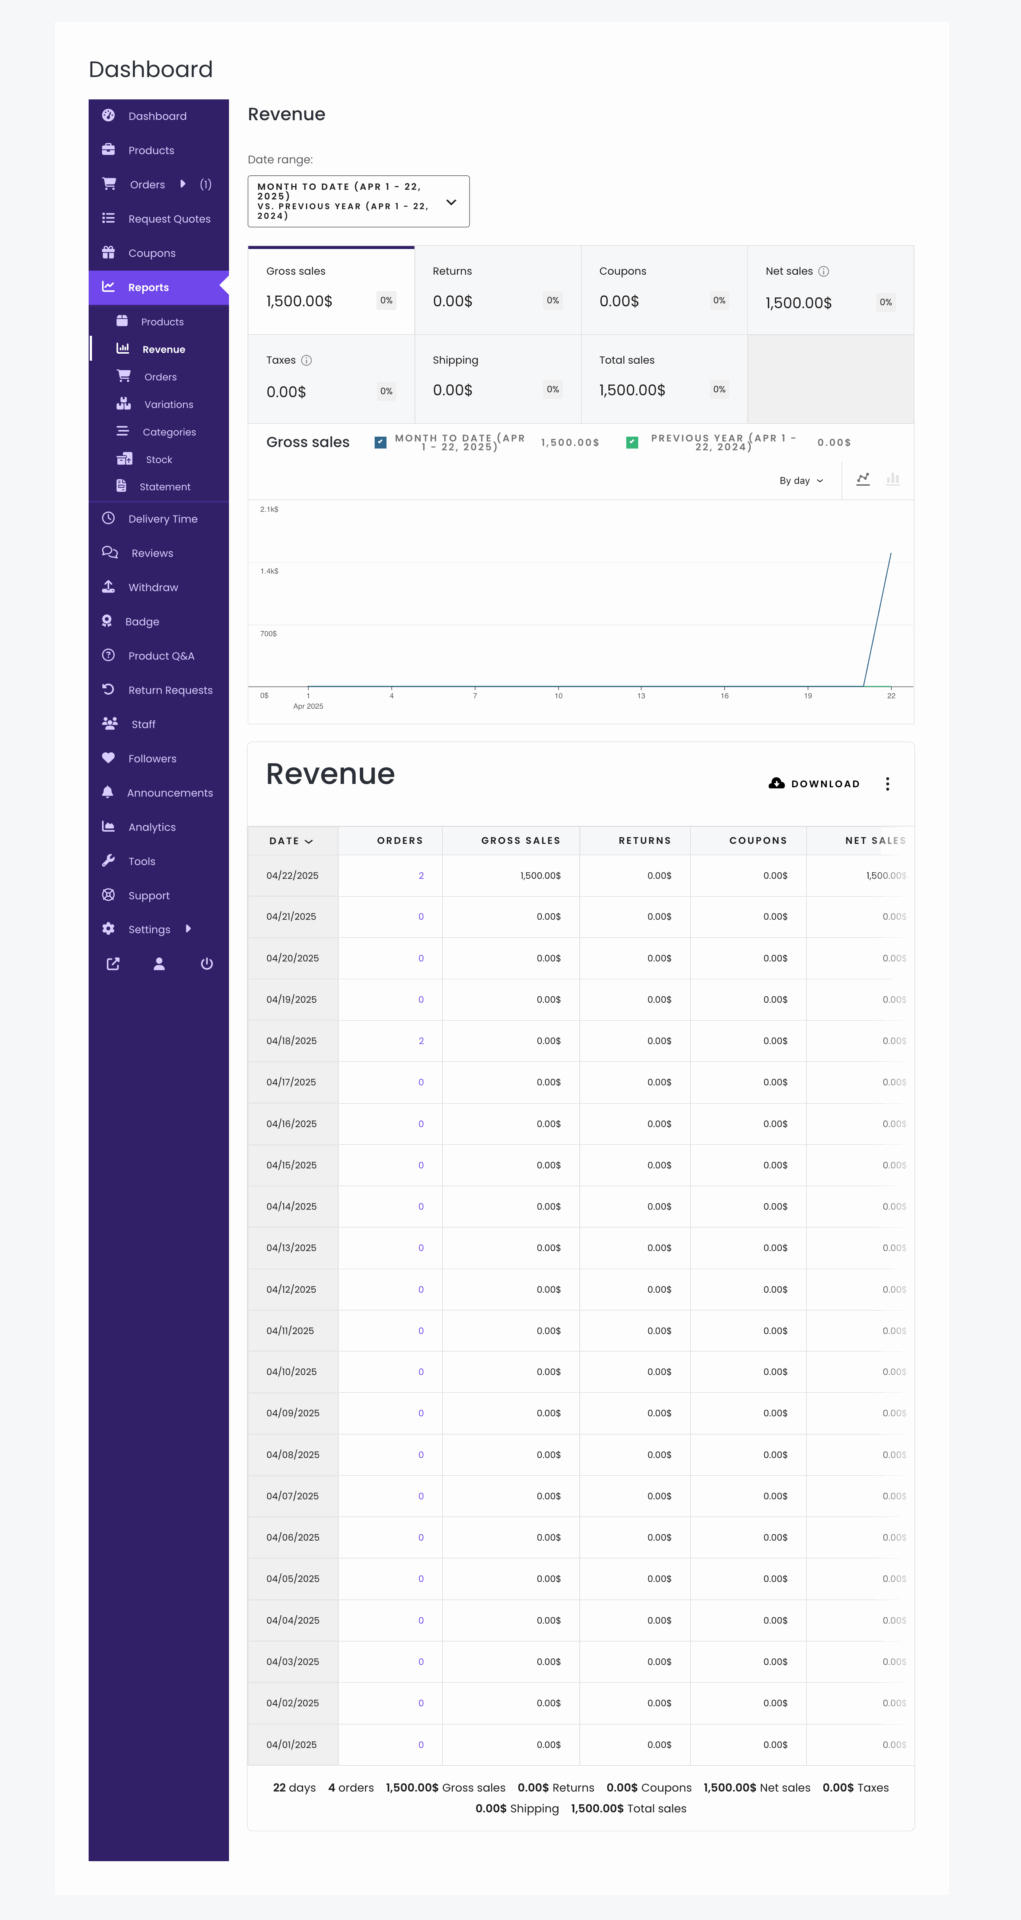
Revenue
In this section, vendors can view their revenue by date, gross sales, returns, coupons, net sales, taxes, shipping, and total sales.
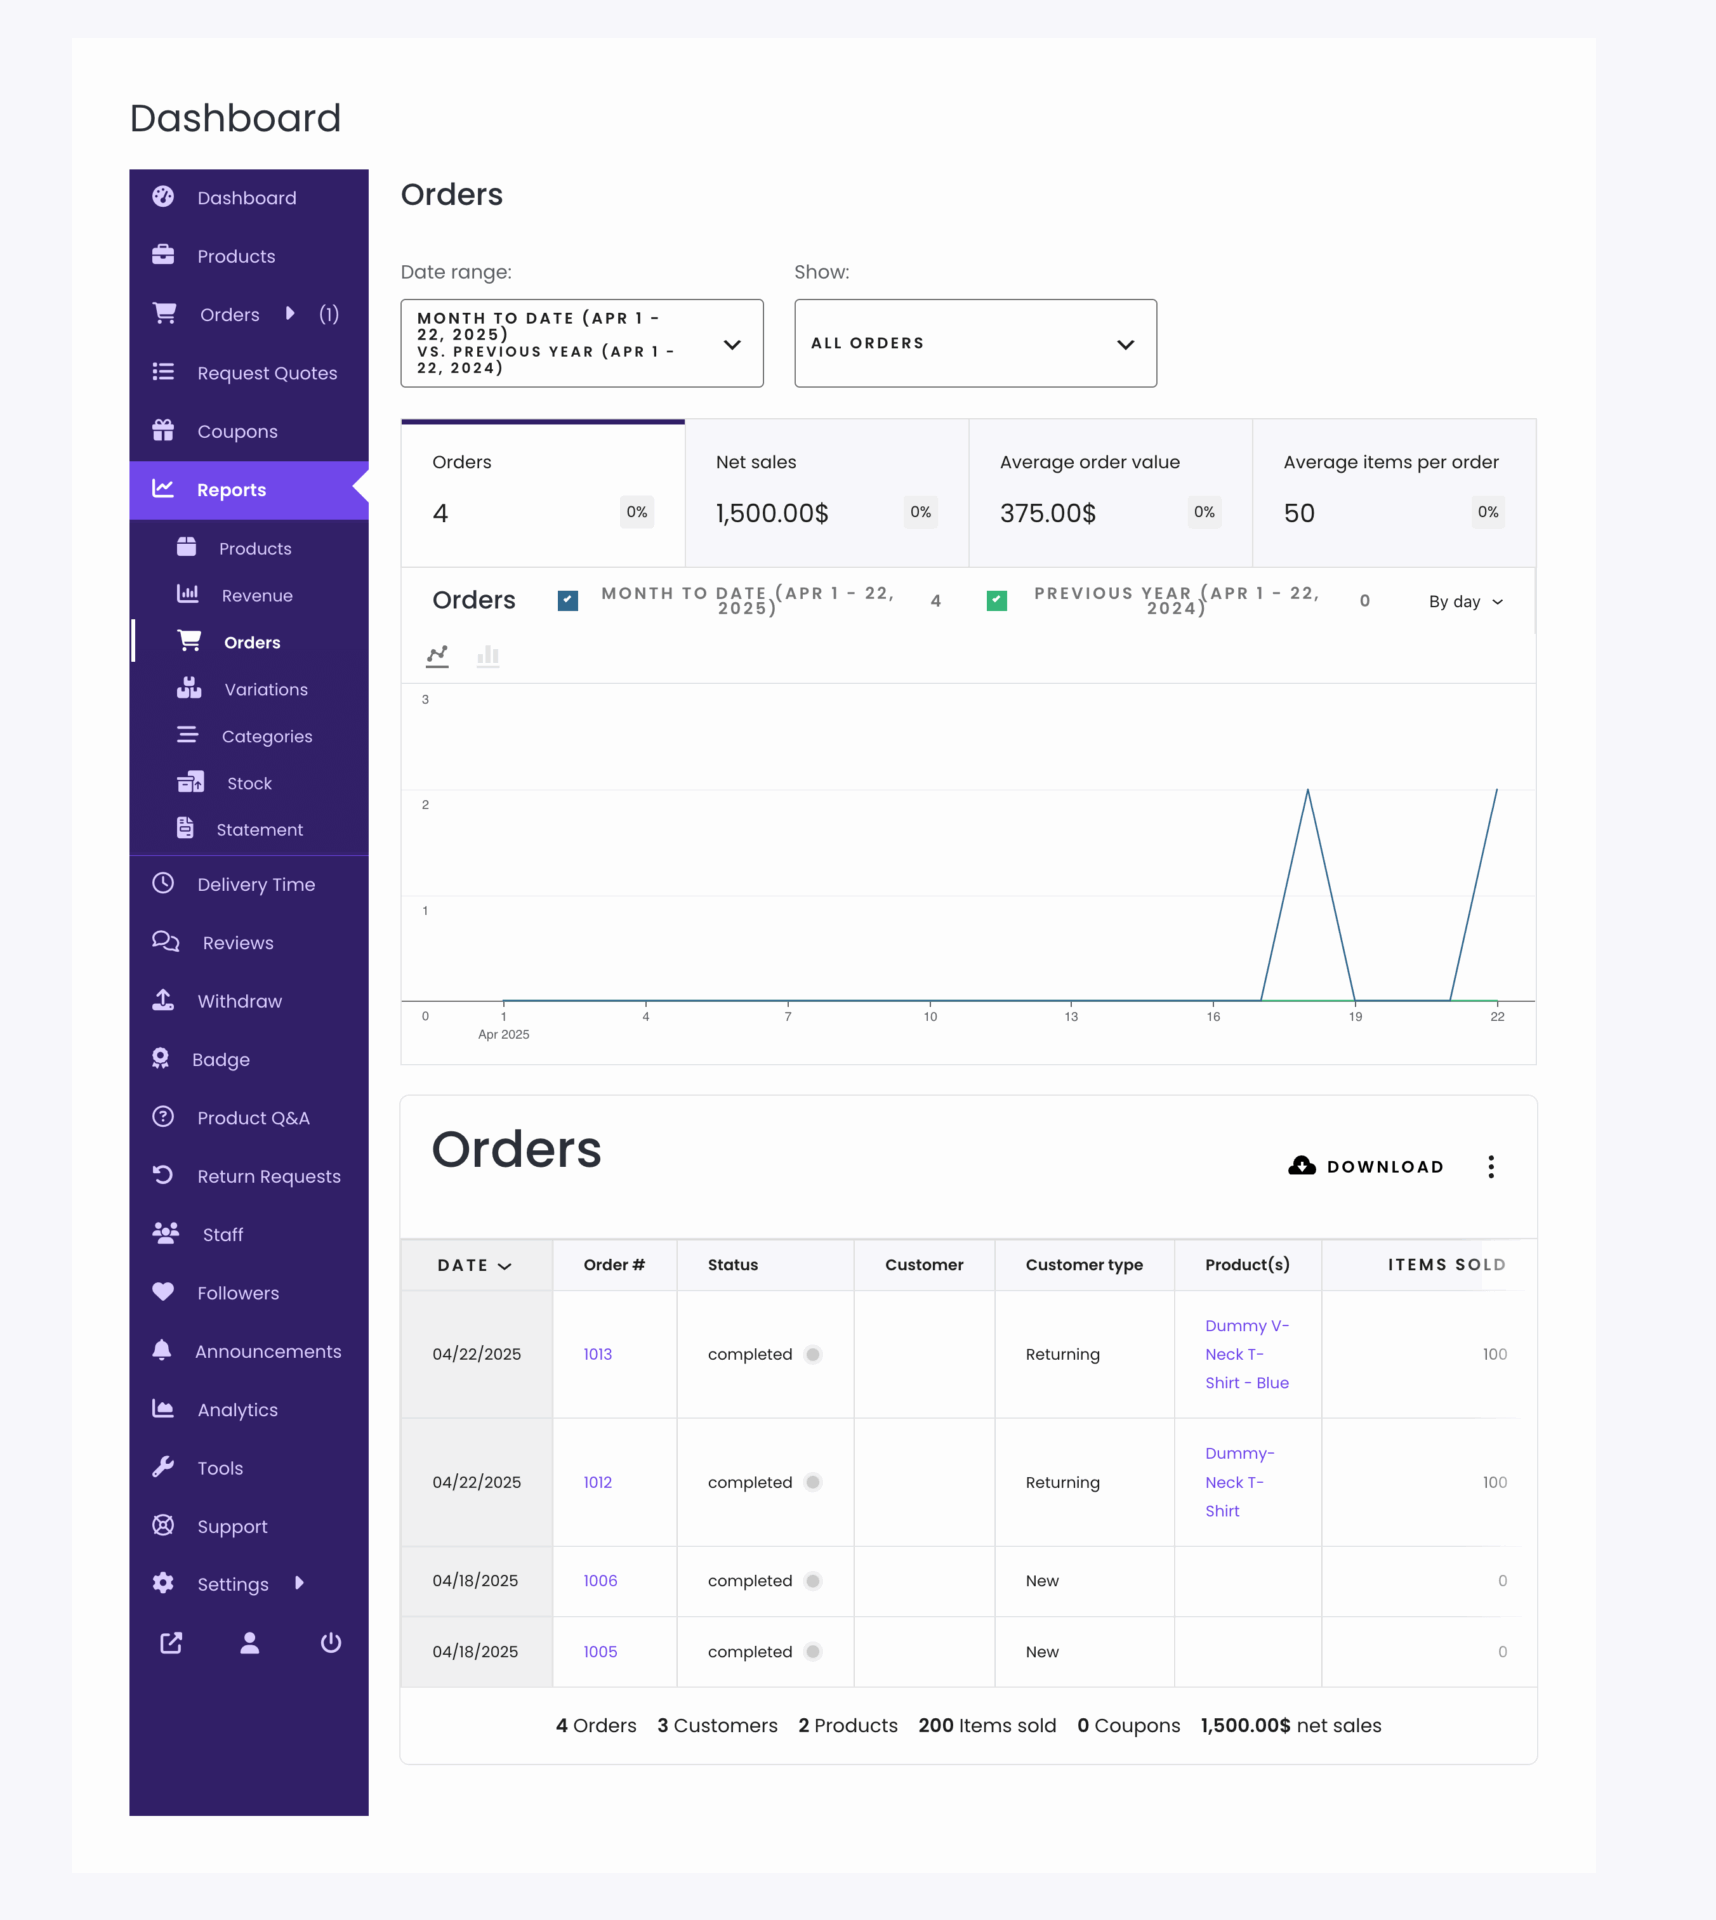
Orders
Here, the vendors can get the overall details of their orders. They can see average order value, average items per order, and number of orders by date-
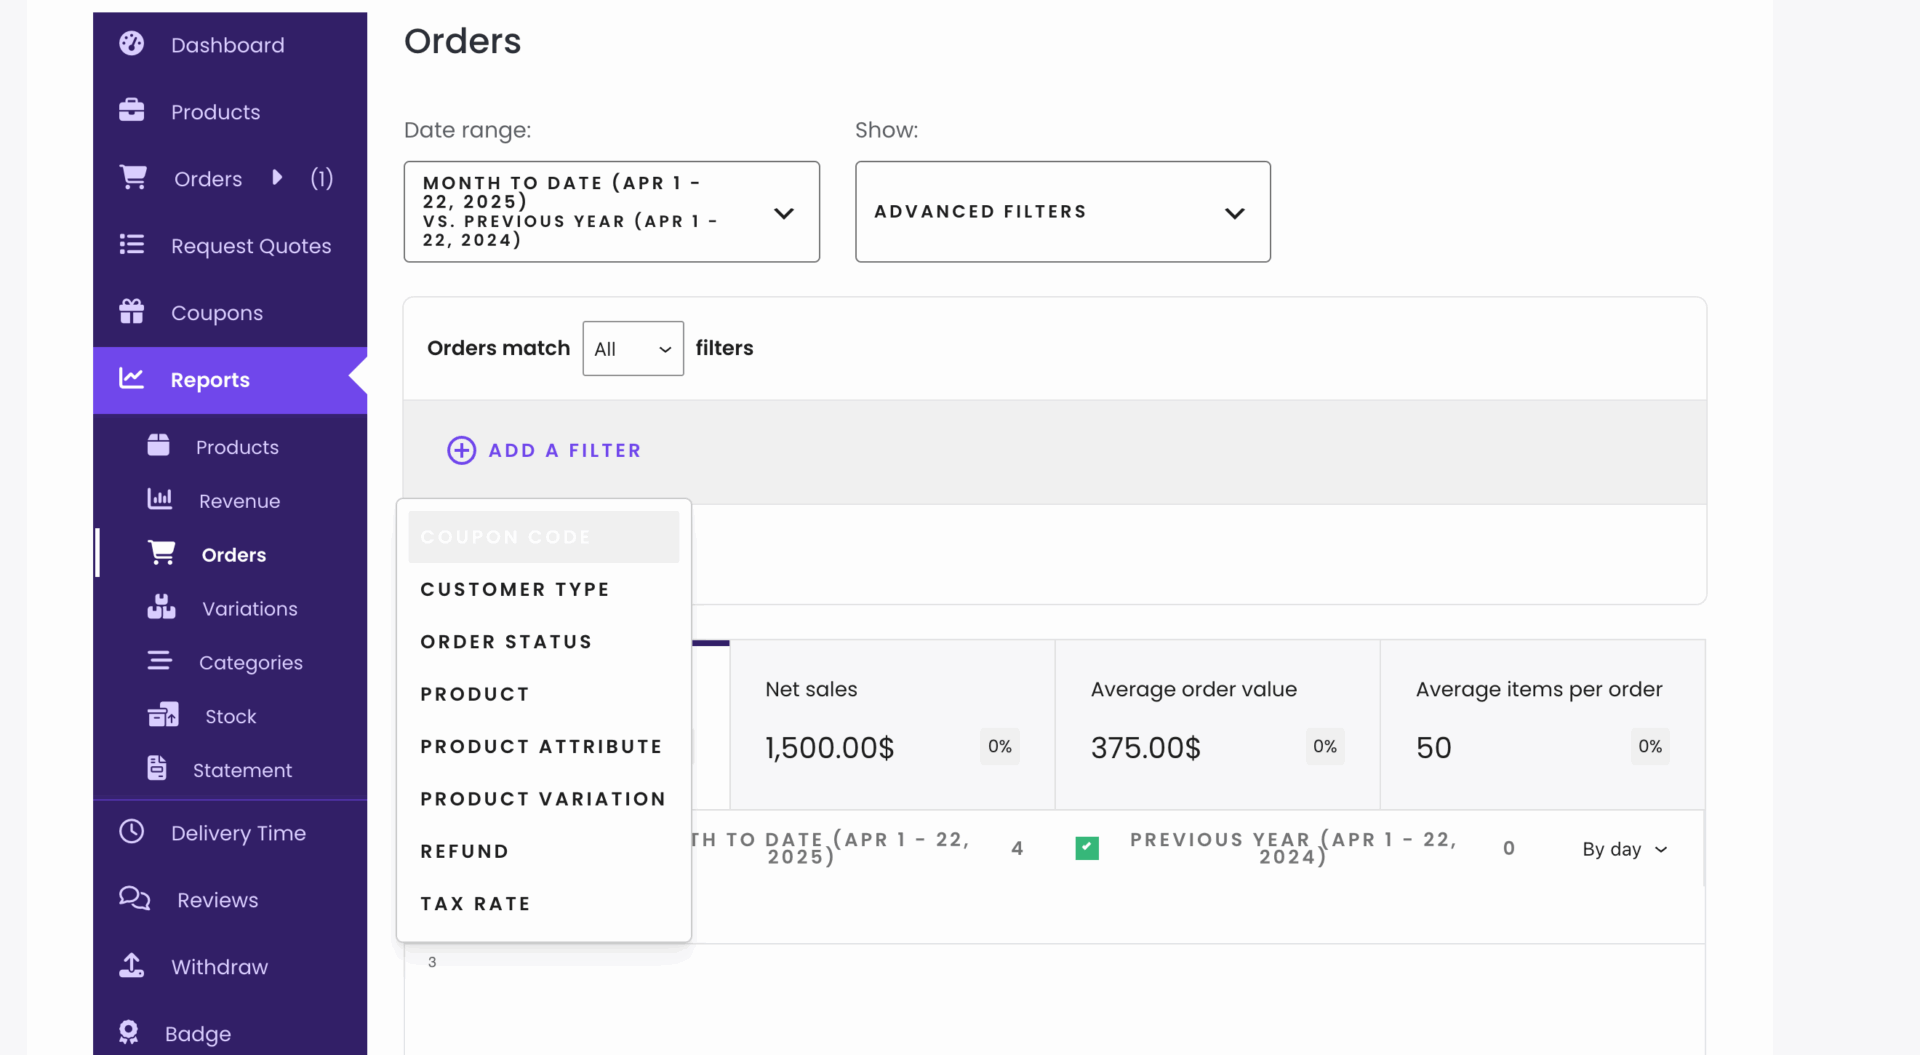
You can also filter the orders using the Advanced filter option-
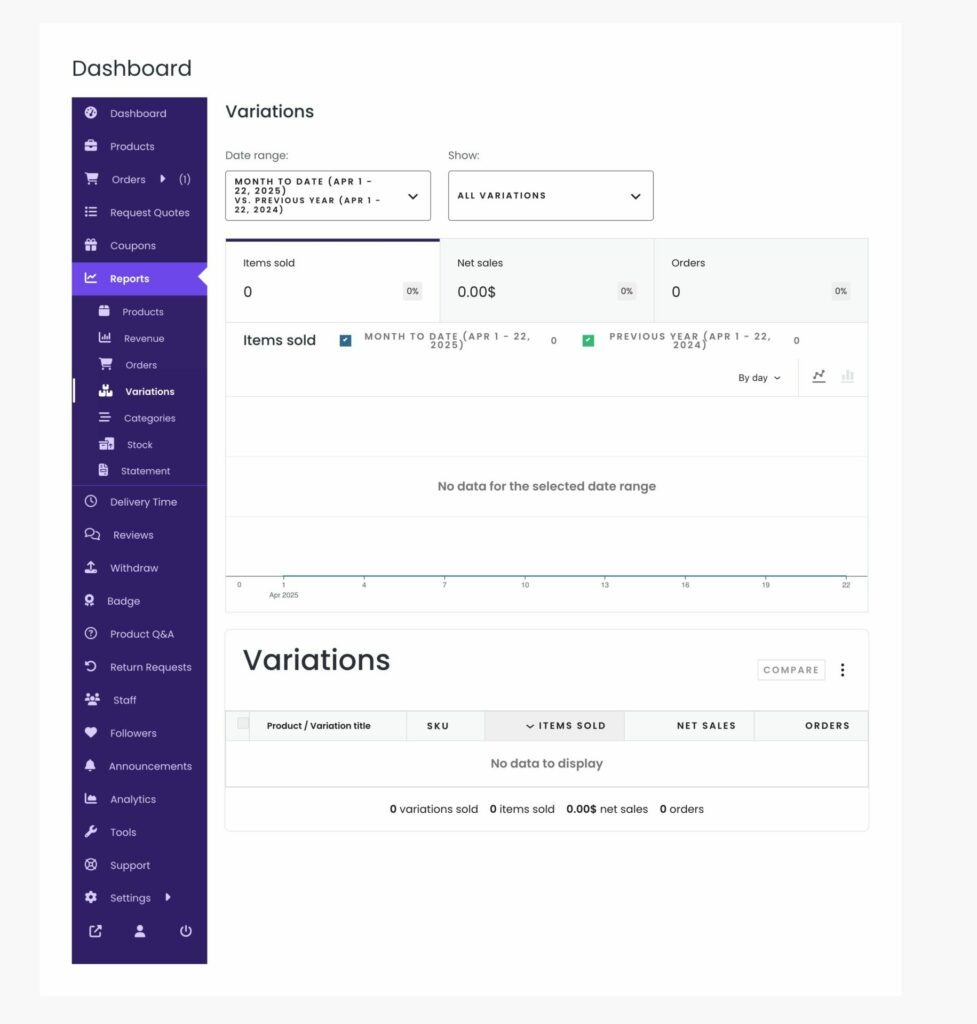
Variations
The vendors can see the report section based on the product variation. From here, they know which variation of the product is selling more-
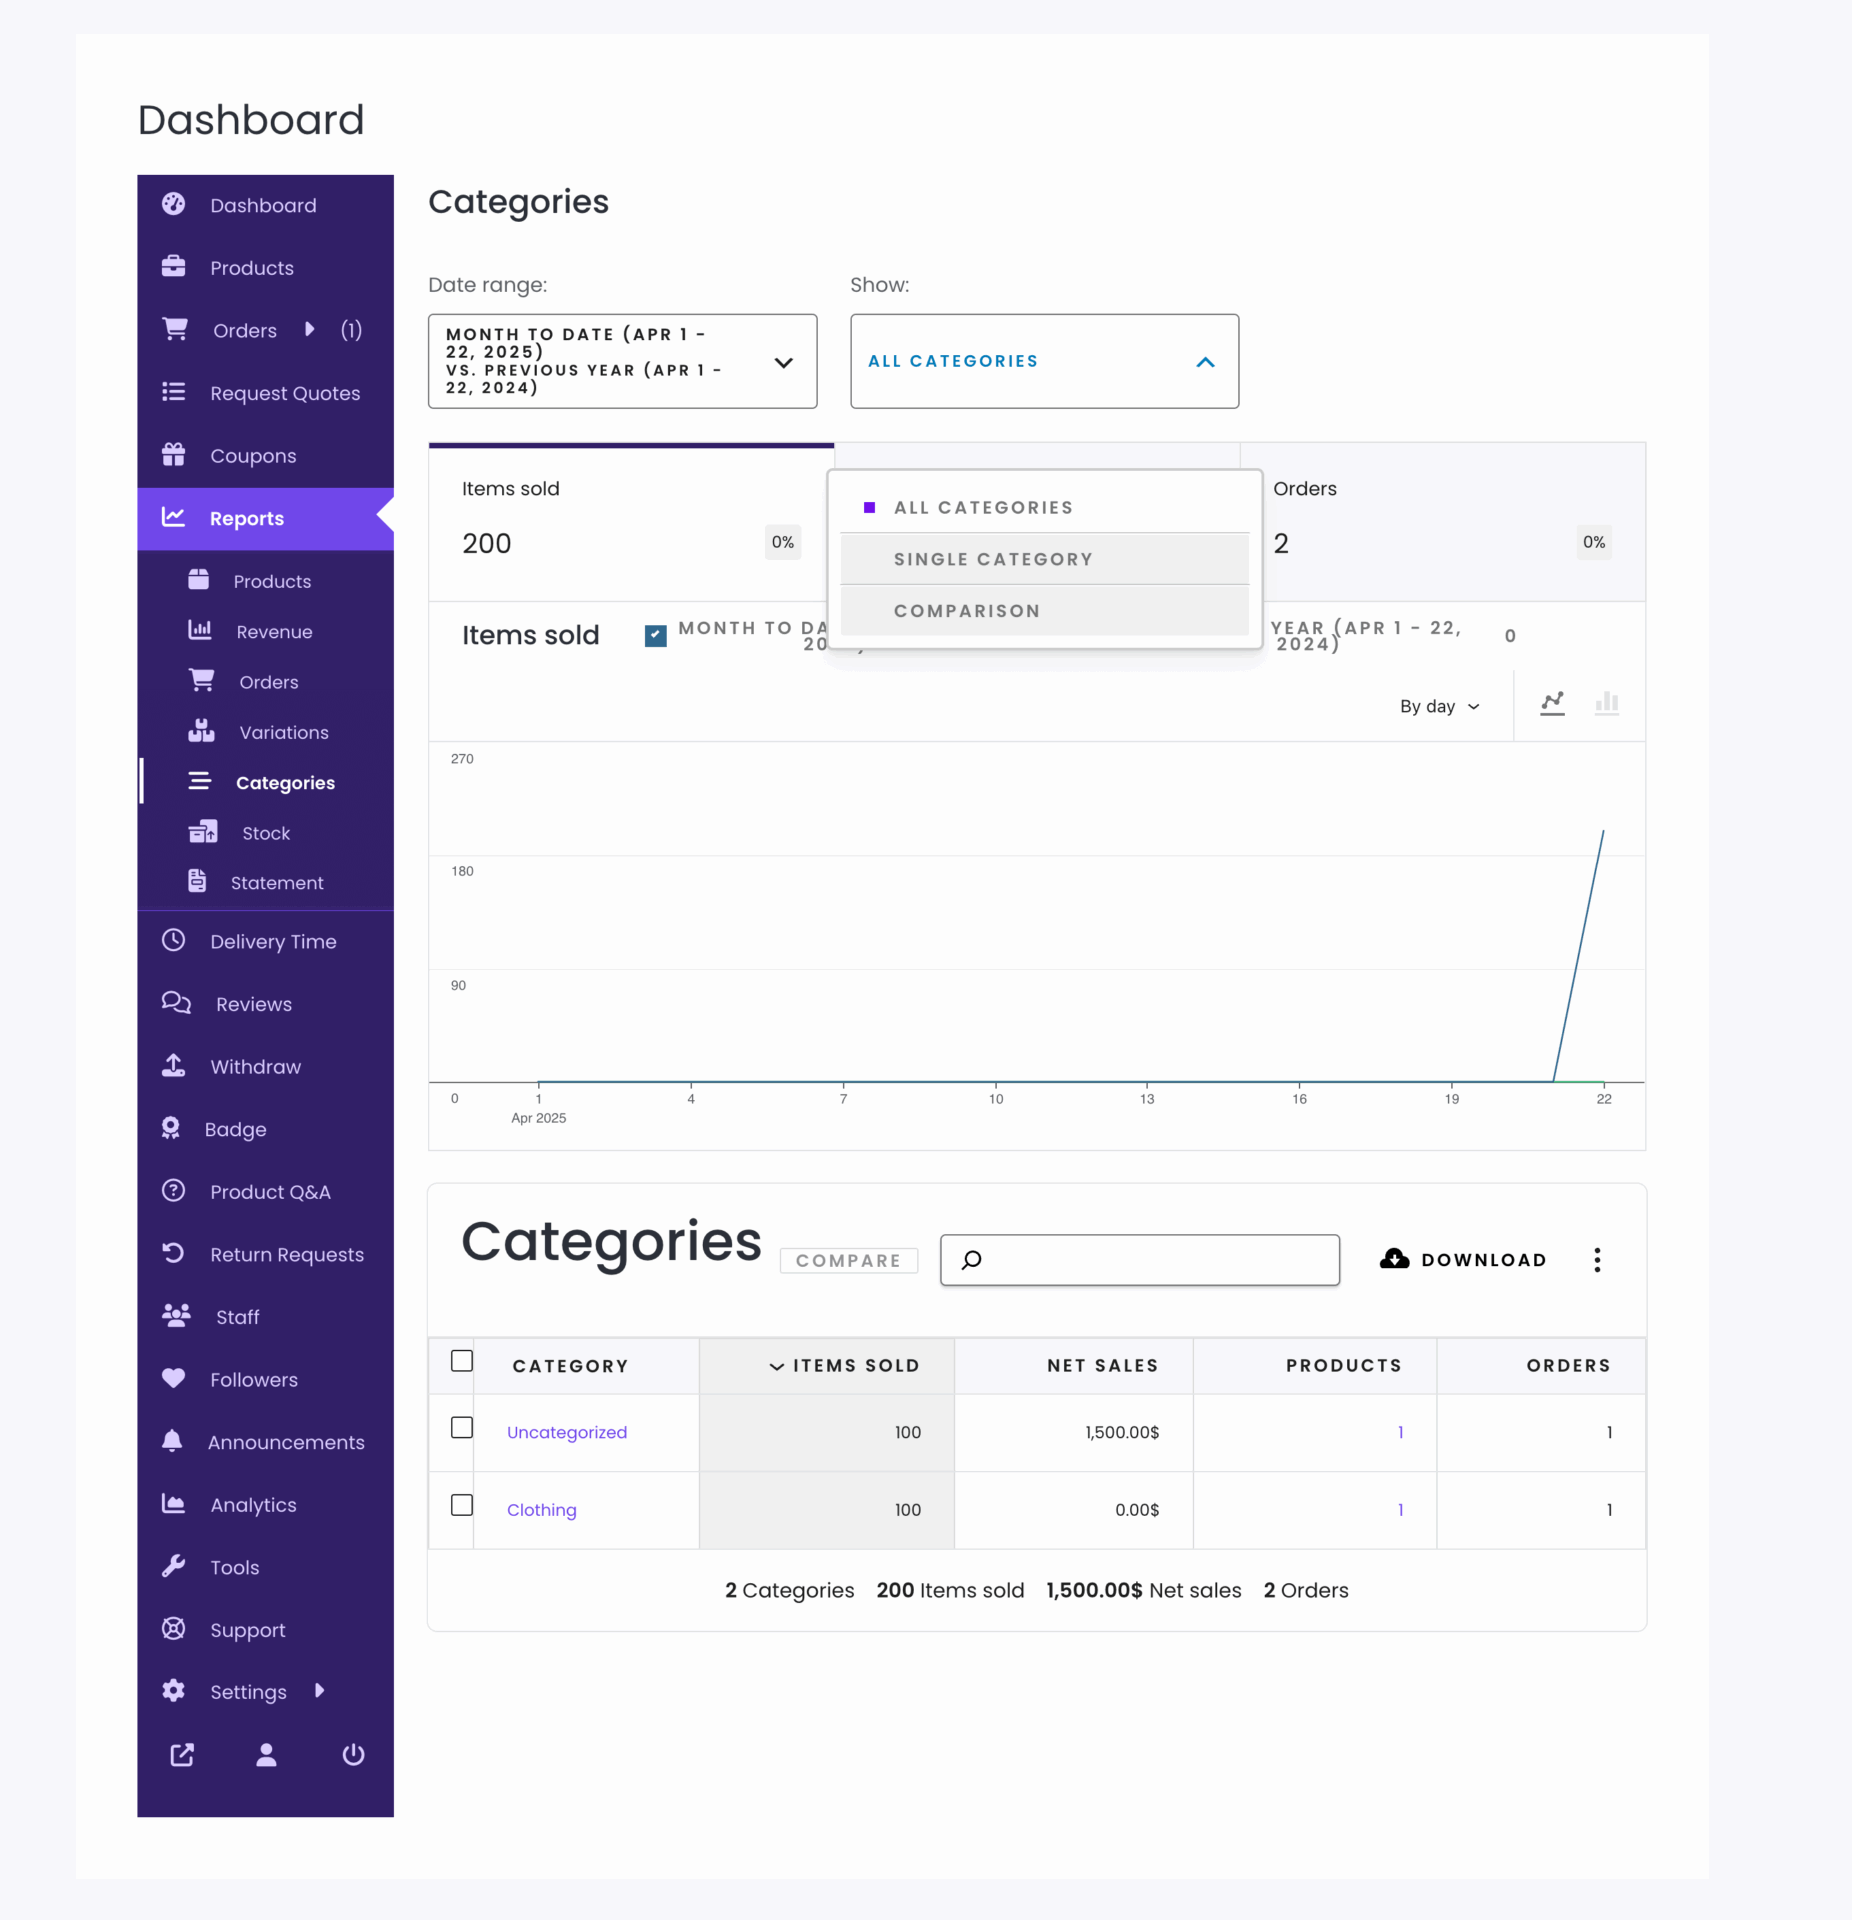
Categories
This section will provide a sales report based on the product categories. Vendors can filter products with single categories or comparisons. You can download the whole report.
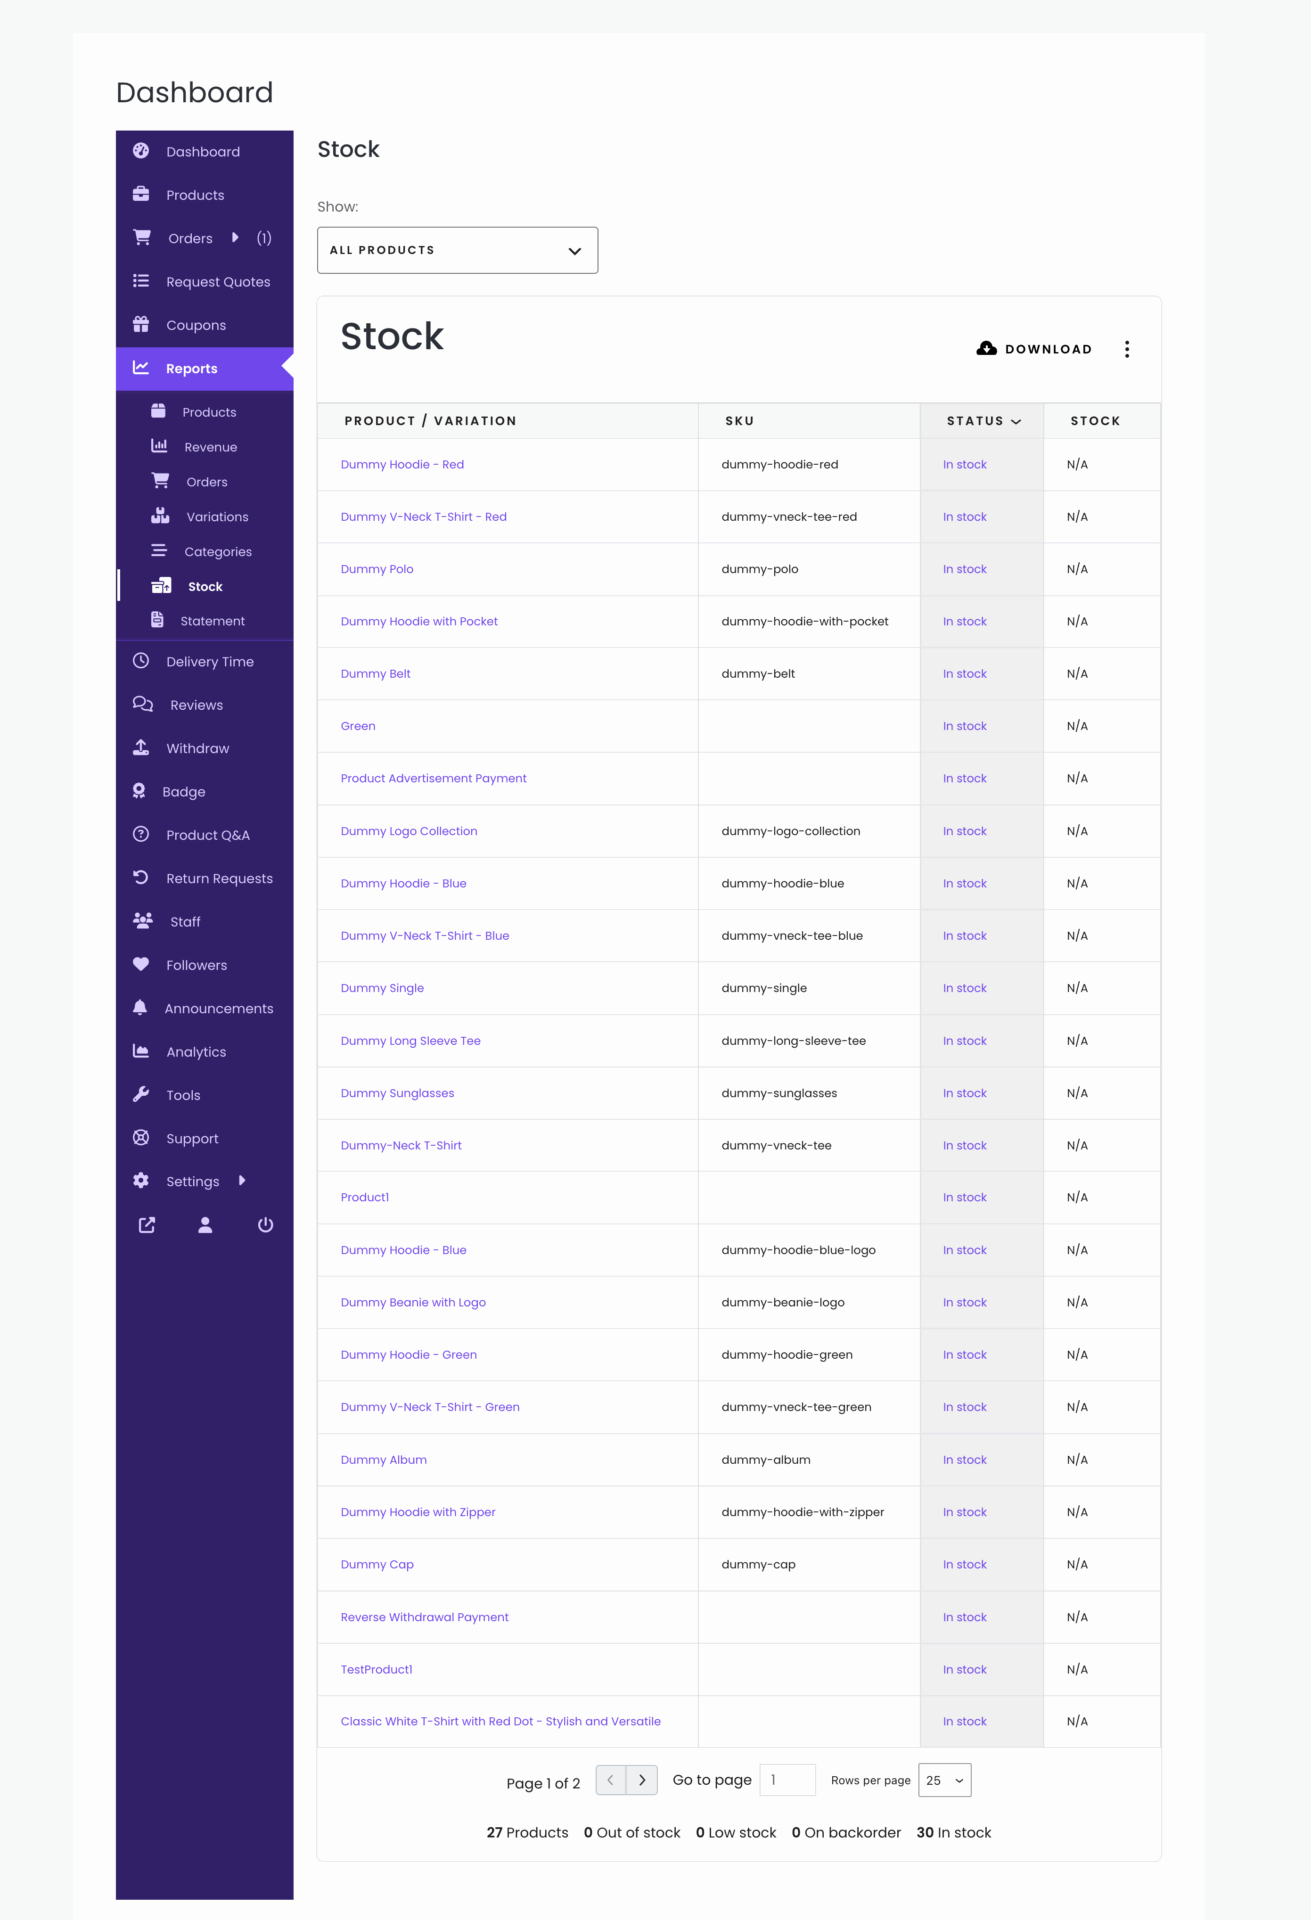
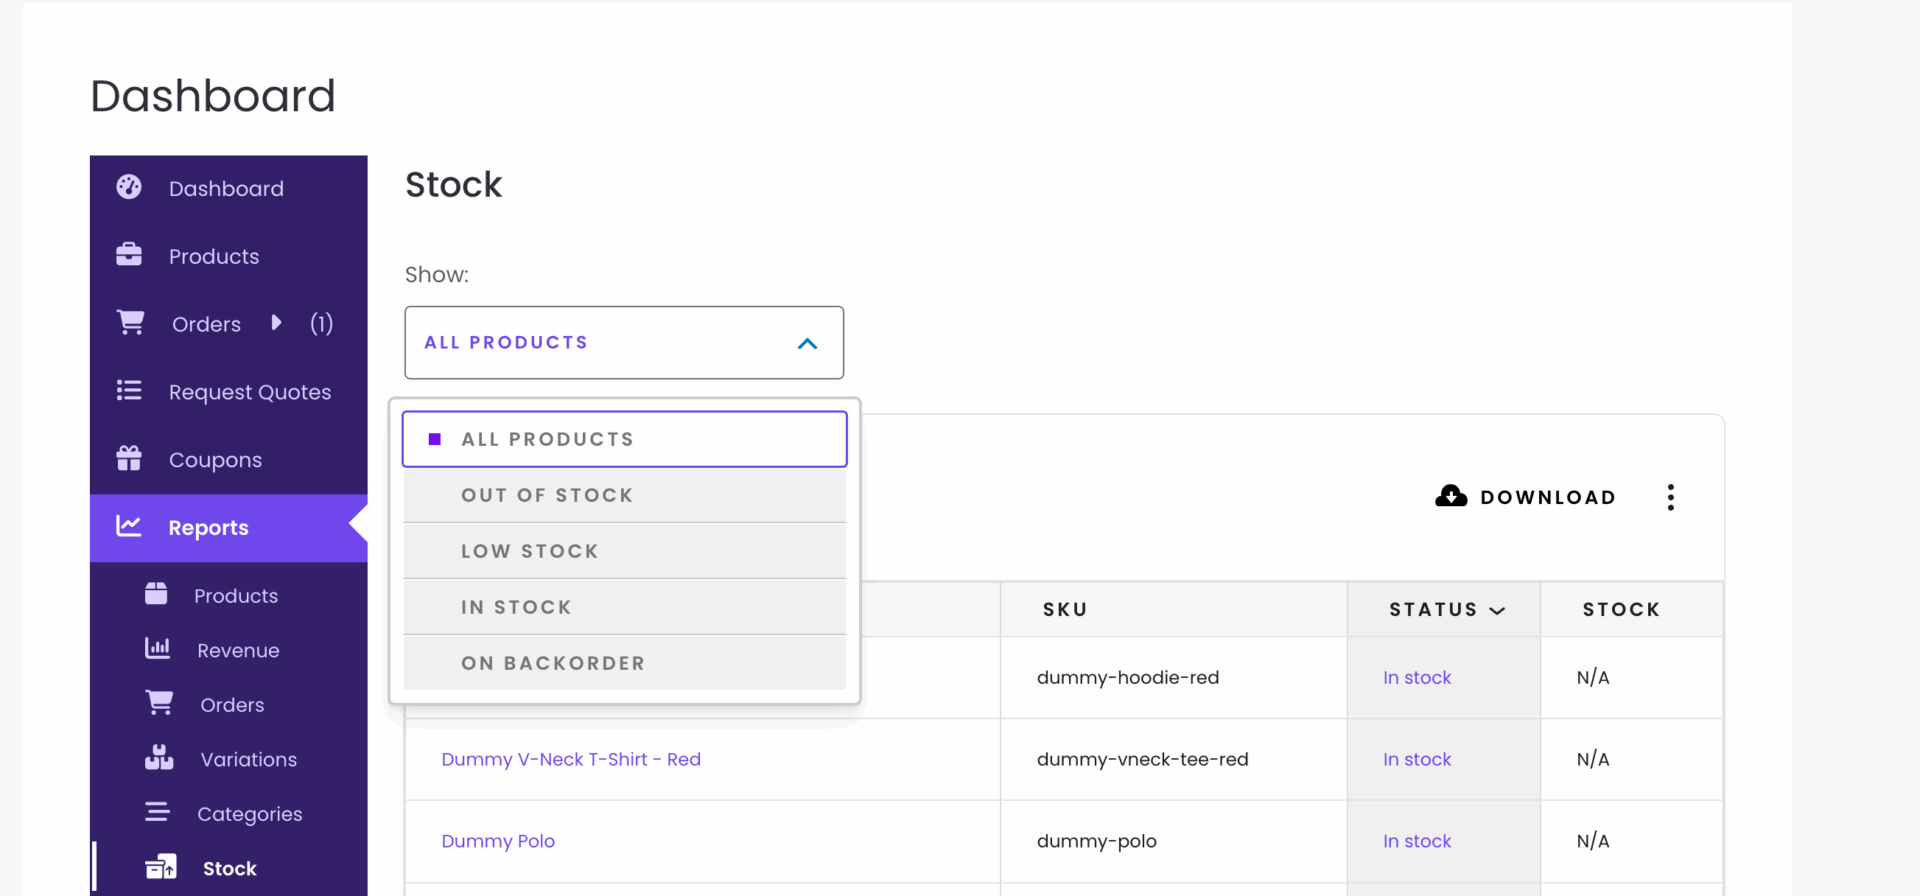
Stock
Vendors can see from this section which products are in stock.
Also, vendors can filter their products based various tags-
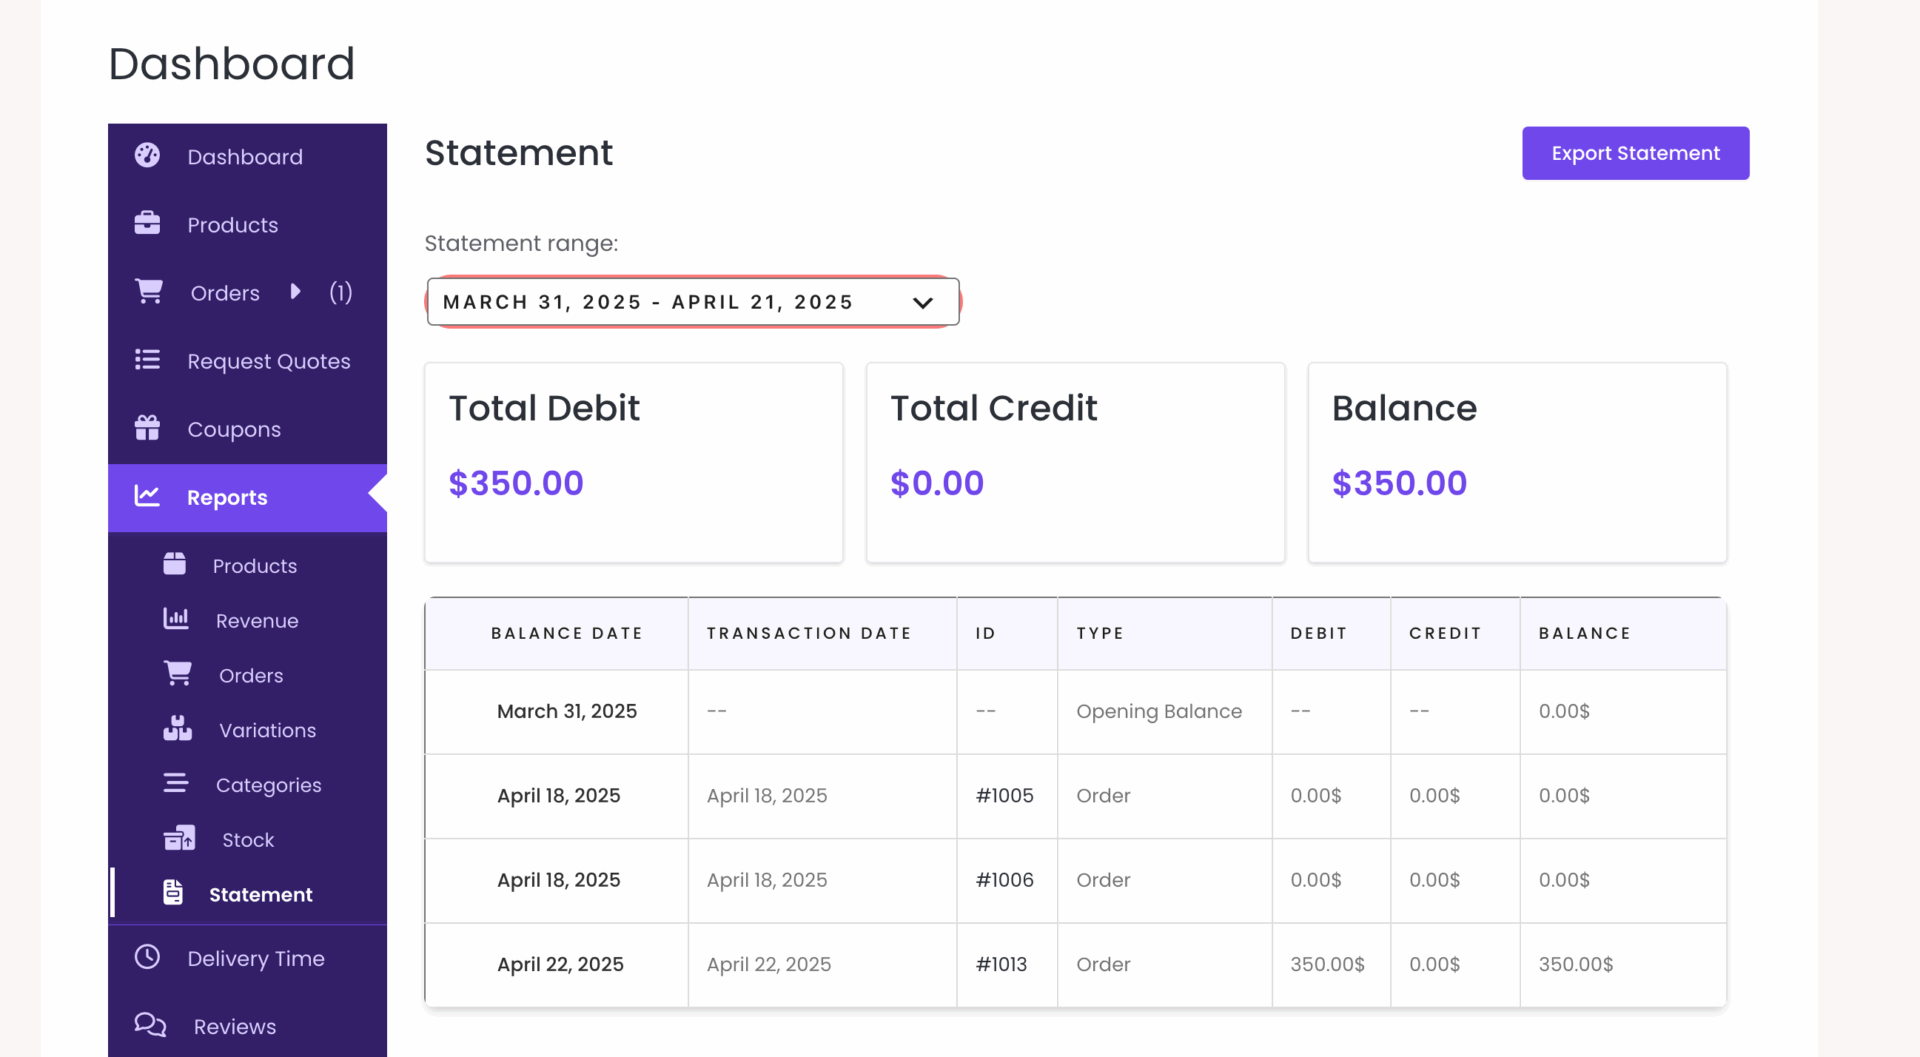
Statement
The statement will show up your transactions analyzing their debit-credit aspects. It will also demonstrate the transaction date, transaction id, Type, and Balance, or those transactions.
Also, vendors can export their statement by clicking on the Export Statement option-
That’s it!
These metrics are good to know –
Metric
Description
Gross Sales
Sale price of product(s) × quantity ordered. Does not include refunds, coupons, taxes, or shipping. Represents top-line revenue before deductions.
Total Sales
(Gross Sales – Returns – Coupons + Taxes + Shipping). It matches the amount that hit your payment gateway and is useful for reconciliation against payouts.
Net Sales
(Gross Sales – Returns – Coupons). The actual product revenue kept, before taxes and shipping. Reflects true profitability trends.
Returns
Value of refunded products (excludes shipping and tax). Rising returns may indicate quality issues or customer-fit problems.
Net Discount Amount
Total sum of discounts from coupons. Reflects the real cost of promotions and how much revenue is given up to secure sales.
Total Tax
(Order Tax + Shipping Tax). Full amount of tax collected, useful for reconciliation during tax filings.
Order Tax
Total tax applied to items in an order. Helps verify item-level tax setups, especially for products taxed differently.
Shipping Tax
Total tax applied to shipping in an order. Indicates the tax portion from shipping charges.
Shipping
Shipping charges associated with an order or refund. Positive number = customer paid for delivery; negative = refunded shipping.
Orders
Number of new orders placed within a selected date range. Simple count of completed check-outs. Combine with Net Sales to see growth from customers or baskets.
Discounted Orders
Count of orders where a coupon was applied. High share of discounted orders may indicate over-reliance on promotions.
Average Order Value (AOV)
(Net Sales / Orders). Shows the average amount each customer spends. Can be increased with cross-sells or bundles.
Items Sold
Raw count of units sold. Important for inventory forecasting and identifying best-sellers.
Average Items per Order
(Items Sold / Orders). Indicates typical basket size. A drop while AOV holds steady may mean fewer items per purchase, but higher-priced ones.
Products Sold
Distinct parent products (not variations) that have recorded at least one sale during the period. Reflects how many different SKUs are actually moving.
Variations Sold
Total count of product variations (e.g., size, color) sold. Helps assess depth within each product line and informs restock decisions.
Downloads
Total number of downloads for digital goods. Tracks how many times customers accessed their purchased files. Spikes may align with updates or promotions.
Total Products
Count of all published products in your catalogue. Snapshot of catalogue size. Consider pruning under-performing products if total products increase, but sales don’t.
In Stock
Products with stock > 0 and not on back-order. These are the items ready to ship.
Low Stock
Products that have reached the low-stock threshold set in WooCommerce. Early warning for restocking before items are out-of-stock.
Out of Stock
Products with stock at 0. Cannot be purchased until replenished. May impact conversion if popular items are out of stock.
On Backorder
Products allowing backorders with negative stock. Customers can still buy, but fulfillment is delayed until restocked.
Total Credit
Sum of all credits in the vendor ledger, including earnings and manual adjustments. Increases your payout balance.
Total Debit
Sum of all debits in the vendor ledger, such as fees and withdrawals. Decreases your payout balance.
Balance
(Total Credit – Total Debit). The available amount for withdrawal. Always double-check before requesting a payout.
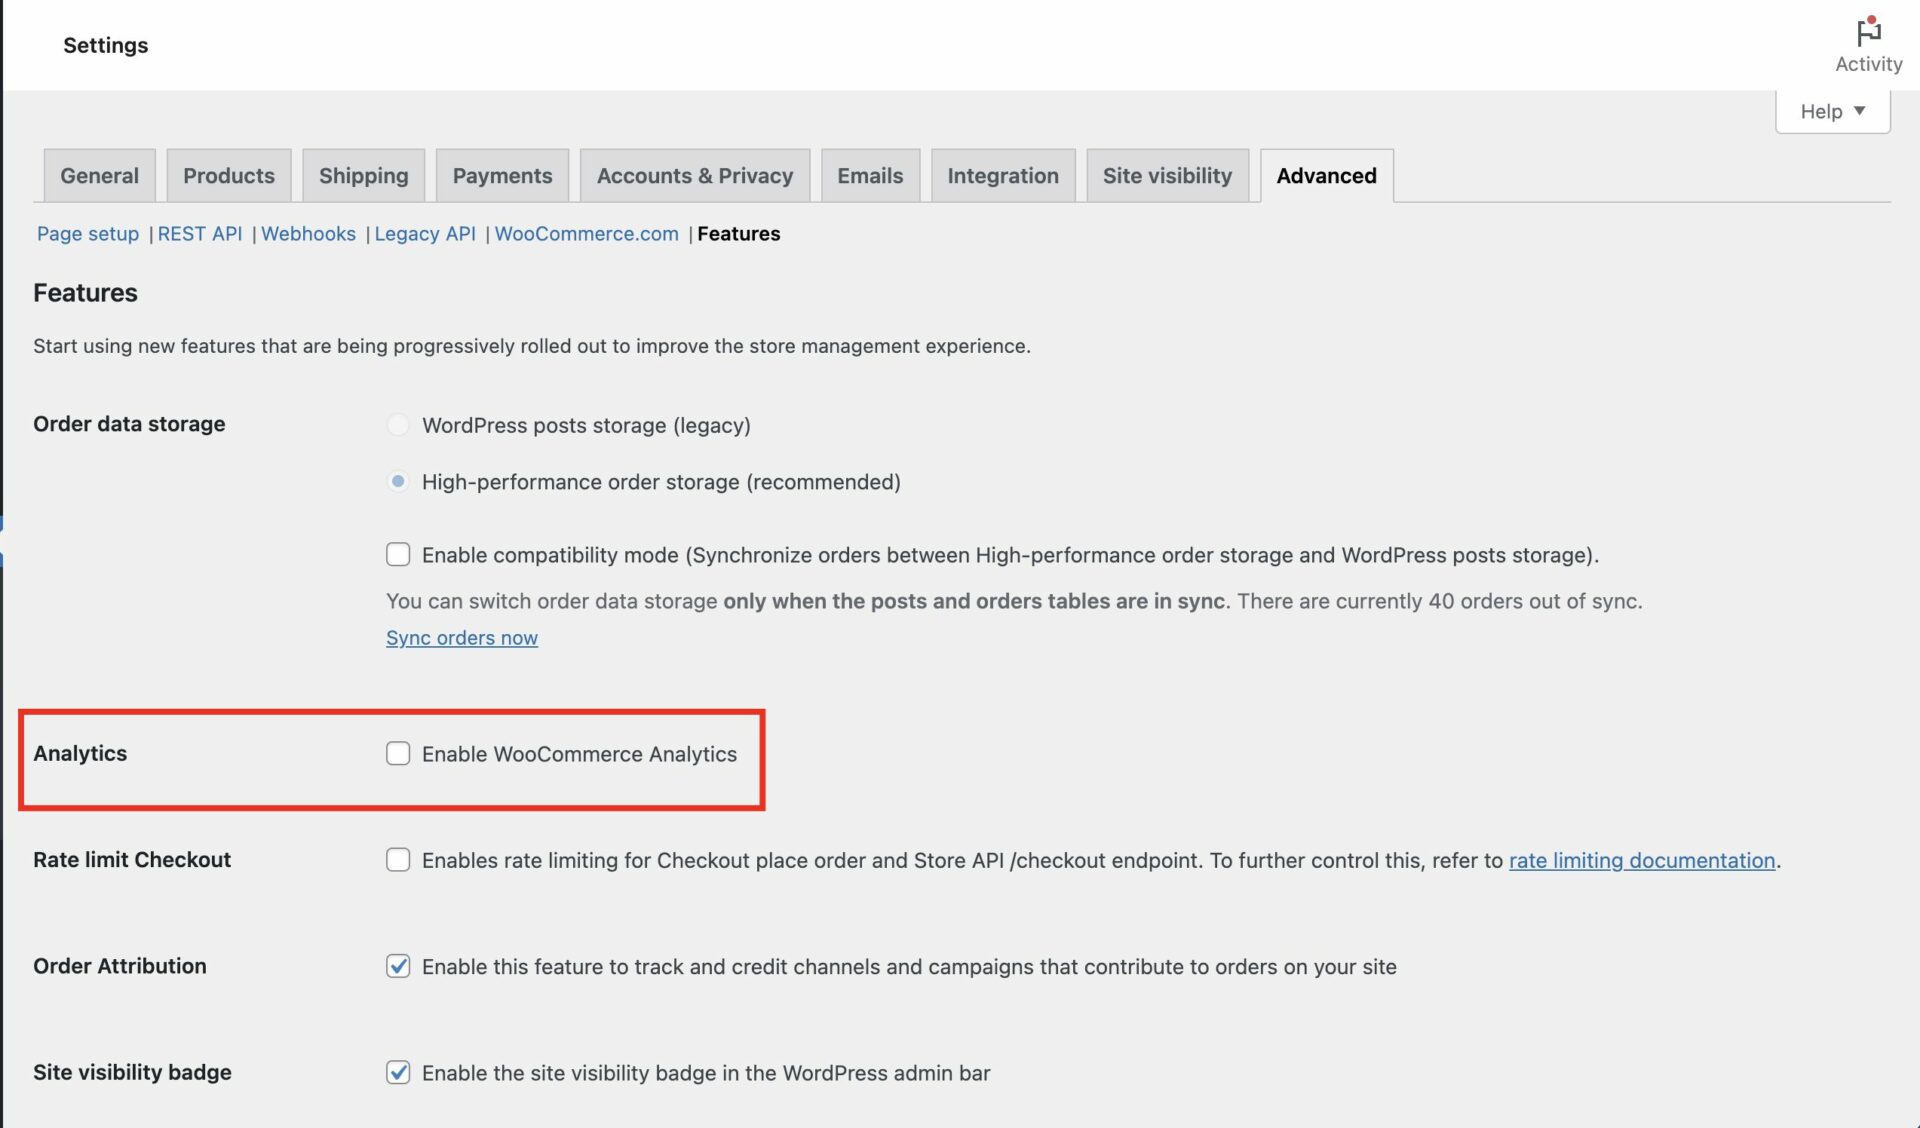
How to Use the Old Version of the Report
If you want to go back to the old version of the report section, then go to WooCommerce–> Settings–> Advanced–> Features, and there uncheck the “Enable WooCommerce Analytics” option-